Download GM 11
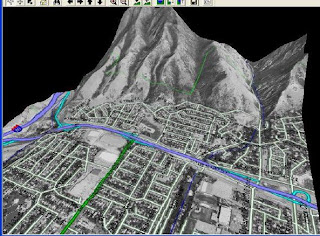
The 3D View command in Global Mapper allows registered users to view gridded elevation data and any overlying raster or vector data in a true perspective 3D manner. When selected, the 3D View command displays a window containing a 3D view of the data in the current Global Mapper view. Any imagery or vector data being drawn on top of the elevation grid(s) in the main Global Mapper view will automatically be draped on top of the elevation data in the 3D View window.The image below depicts a sample of the 3D View window displayed using 250K USGS DEM data for Salt Lake City, UT overlaid with DOQ satellite imagery from the TerraServer import command under the File menu. The 3D View window contains a toolbar with command buttons allowing you to modify the default view. You can use the mouse to rotate the view around as well as zoom in. The arrow keys on the toolbar allow you to pan the data visible in the 3D view in any direction. The zoom in and out buttons allow you to zoom in or out on the center of the 3D view. Additional buttons are also available for modifying the vertical exaggeration, displaying water, and saving the 3D view contents to a Windows BMP, TIFF, PNG, or JPG file.
The 3D View command in Global Mapper allows registered users to view gridded elevation data and any overlying raster or vector data in a true perspective 3D manner. When selected, the 3D View command displays a window containing a 3D view of the data in the current Global Mapper view. Any imagery or vector data being drawn on top of the elevation grid(s) in the main Global Mapper view will automatically be draped on top of the elevation data in the 3D View window.The image below depicts a sample of the 3D View window displayed using 250K USGS DEM data for Salt Lake City, UT overlaid with DOQ satellite imagery from the TerraServer import command under the File menu. The 3D View window contains a toolbar with command buttons allowing you to modify the default view. You can use the mouse to rotate the view around as well as zoom in. The arrow keys on the toolbar allow you to pan the data visible in the 3D view in any direction. The zoom in and out buttons allow you to zoom in or out on the center of the 3D view. Additional buttons are also available for modifying the vertical exaggeration, displaying water, and saving the 3D view contents to a Windows BMP, TIFF, PNG, or JPG file.

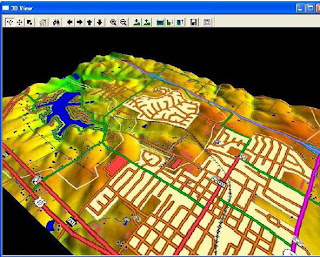
The contents of the 3D View window will always reflect what is visible in the main Global Mapper view. This means that as you pan and zoom around the main Global Mapper view, the contents of the 3D View window will pan and zoom around as well. The reverse is also true in that the pan and zoom buttons on the 3D View window will cause the main Global Mapper view to pan and zoom as well. Another example of the 3D view is displayed below. This time, it is several 24K USGS DLGs for Blue Springs, MO overlaid on several 24K USGS DEMs for the same area.
You can also save a measurement to a separate feature by right clicking and selecting "Save Measurement" from the list that pops up. You can then export these measurements to new vector files, such as Shapefiles or DXF, or modify them with the Digitizer Tool. There is also an option to copy the measurement text to the clipboard when you right-click. If you have gridded elevation data loaded under the measurement, you can also calculate the Cut-and-Fill volume either within the measurement area or within some distance of the measurement line. To do this,
simply right click then select the "Measure Volume (Cut-and-Fill)" option that appears. Selecting this option will display the Setup Volume Calculation Parameters dialog (pictured below), which allows you to set up thevolume measurement.
simply right click then select the "Measure Volume (Cut-and-Fill)" option that appears. Selecting this option will display the Setup Volume Calculation Parameters dialog (pictured below), which allows you to set up thevolume measurement.
Pathloss With Global Mapper:
The PathProfile/LOS command selects the 3D path profile/LOS (line of sight) tool as the current tool. This tool allows you to get a vertical profile along a user-specified path using loaded elevation datasets. In addition, registered users can perform line of sight calculations along the defined path. To define the path along which to generate the 3D path profile, first select the path profile tool as your current tool. Press and release the left mouse button at the position where you wish to start the path. Move the mouseto the next position that you want to include in the path profile, then press the left mouse button again. Right click on the last location in the path profile to complete selecting points and display the Path Profile/Line of Sight dialog (pictured below). The Path Profile/Line of Sight dialog will appear displaying the 3D path profile of the selected path. Any points along the path that did not have elevation data underneath will be treated as an elevation of zero. You can also generate 3D path profiles for existing line features by selecting the line feature in the Digitizer Tool, right clicking, then selecting the Generate Path Profile From Line option on the menu that is displayed.
 The Path Profile/Line of Sight dialog displays the 3D path profile and provides several options related to the profile. A vertical scale is displayed on the left hand side of the profile window. The start and end coordinates of the path are displayed at the top of the profile window. If more than two points are in the path, the intermediate points will be marked in the profile window with a yellow dot. These intermediate points can be toggled on and off using an option available by right clicking on the path profile window. Also note that this dialog is resizable. Right clicking on the profile window brings up an options menu allowing the user to change the start and end positions, select the units (meters or feet) to display the elevations in, configure display of the path profile, and display a dialog containing details about the path. These options are also available under the Options menu on the dialog. The File menu contains options allowing you to save the path profile/line of sight data to a file. The individual options are described below. The Save To Bitmap... option allows registered users to save the contents of the path profile window to aWindows bitmap (BMP) file for use in other applications.


No comments:
Post a Comment