Monday, March 29, 2010

Emission Designators

An emission designator utilizes a seven-character “word” to represent the bandwidth, modulation, nature of signal, and type of information transmitted by a particular radio. The emission designator is required in most FCC radio applications. An emission designator consists of seven characters as follows:

· The first four characters identify the necessary bandwidth required to transmit the desired information at the rate and with the quality required for the system employed;
· The fifth character identifies the type of modulation of the main carrier;
· The sixth character identifies the nature of signal(s) modulating the main carrier;
· The seventh character identifies the type of information to be transmitted.

Detailed information and examples of each of the four components are provided below. Necessary Bandwidth – First Four Characters The necessary bandwidth is to be expressed using three numerals and one letter. The letter occupies the position of the decimal point and represents the unit of bandwidth. The first character can be neither zero, K, M, nor G; it must be a non-zero digit or H. The necessary bandwidths must be rounded to three significant digits. The rounded value of the necessary bandwidth must follow the syntax below:

· between 0.00100 and 999 Hz shall be expressed in Hz (letter H);
· between 1.00 and 999 kHz shall be expressed in kHz (letter K);
· between 1.00 and 999 MHz shall be expressed in MHz (letter M);
· between 1.00 and 999 GHz shall be expressed in GHz (letter G).

Examples:

Guide to Emission Designators (continued). Types of Modulation of the Main Carrier – Fifth Character.

NOTE: Whenever frequency modulation "F" is indicated, Phase modulation "G" is also acceptable. Emissions where the main carrier is directly modulated by a signal which has been coded into quantized form (e.g. pulse code modulation) should be designated under amplitude modulation or angle modulation.

Nature of Signal(s) Modulating the Main Carrier – Sixth Character


Type of Information to be Transmitted – Seventh Character


Friday, March 26, 2010

Pathloss 4.0 : Frequency Interference Calculations for the Network

After completing all the above processes for all the link you should calculate if there will be any frequency interference cases in the designed Network (if there are any existing links working with the same frequency band you have to add it to your network before calculating interference)

How to Calculate frequency Interference

2.6.1- Go to Network Page by clicking ctrl N – Defaults menu – Link Label
Select TX Frequency & Polarization – Press Rest All as per shown in Fig. 2.6.1

Fig. 2.6.1
Have a look to your network & make sure that all links Frequencies & Polarizations are correct according to your plan. If there is any mistake in any link please go to its work sheet & make it correct

2.6.2- Go to Interference Menu & Click Calculate Intra as per shown in Fig. 2.6.2

Fig. 2.6.2

2.6.3- Set the Interference Calculation criteria according to Specs. & press Calculate as per shown in Fig. 2.6.3

Fig. 2.6.3

2.6.4- Go to Interference Menu – Report – Cross Reference as shown in Fig. 2.6.4

Fig. 2.6.4

2.6.5- You will get Interferences cases as below example.
Study carefully those interference cases & if any one of them is dangerous case please re-plan you network frequencies or change your antenna type to higher XPD antennas. Also you can use ATPC function to keep lower TX power which will help to avoid some interference cases

Interference Cross Reference - Bharti Delhi (final).gr4

Coordination Distance (km) 100.00 obj Interference level objective (dBm)
Maximum frequency Separation (MHz) 28.00 v-i Victim to interferer path length (km)
Default Minimum Interference Level (dBm) -105.00 tad Total antenna discrimination (dB)
Margin (dB) 10.00 ifl Interfering Signal (dBm)
Threshold degradation objective (db) 3.00 td Threshold Degradation (dB)
Total number of cases calculated 87 * OHLOSS
Calculation made on ÇáÇÍI, NEíÚ ÇáAaá 10 1424 09:46:00 a

Case 1 Charmwood (Okhla), VHP4A-142, 14963.0000H, STM1-128QAM, obj = -98.6
1-1 Faridabad (Charmwood), VHP2-142, 14963.0000V, STM1-128QAM, v-i = 3.3, tad = 70.0 (i 0.0° v -191.9°), ifl = -102.0 (3.5), td = 1.6
1-2 Okhla (Sarita Vihar), VHP2-142, 14963.0000V, STM1-128QAM, v-i = 3.5, tad = 68.0 (i 128.8° v 0.0°), ifl = -100.2 (1.7), td = 2.2

Case 2 Okhla (Charmwood), VHP2-142, 14543.0000H, STM1-128QAM, obj = -98.6
2-1 Charmwood (Faridabad), VHP4A-142, 14543.0000V, STM1-128QAM, v-i = 3.5, tad = 67.0 (i 191.9° v 0.0°), ifl = -99.1 (0.5), td = 2.7
2-2 Faridabad19 (Faridabad), VHP2-142, 14543.0000V, STM1-128QAM, v-i = 11.0, tad = 52.2 (i -5.7° v -2.3°), ifl = -100.3 (1.7), td = 2.2 *
2-3 Sarita Vihar (Okhla), VHP2-142, 14543.0000V, STM1-128QAM, v-i = 2.0, tad = 68.0 (i 0.0° v -128.8°), ifl = -101.4 (2.9), td = 1.8

Case 3 Faridabad (Charmwood), VHP2-142, 14543.0000V, STM1-128QAM, obj = -98.6
3-1 Charmwood (Okhla), VHP4A-142, 14543.0000H, STM1-128QAM, v-i = 3.3, tad = 70.0 (i -191.9° v 0.0°), ifl = -101.8 (3.2), td = 1.7
3-2 Faridabad19 (Faridabad), VHP2-142, 14543.0000V, STM1-128QAM, v-i = 4.2, tad = 62.0 (i 0.0° v -164.7°), ifl = -102.0 (3.4), td = 1.6
3-3 Shalimar Bagh (Wazipur), VHP4A-142, 14543.0000V, STM1-128QAM, v-i = 31.4, tad = 30.1 (i 9.4° v 1.0°), ifl = -81.5 (-17.0), td = 17.1 *
3-4 Kamal Hotel (Gopala Tower), VHP2-142, 14543.0000H, STM1-128QAM, v-i = 25.2, tad = 48.3 (i -38.8° v -0.5°), ifl = -103.8 (5.2), td = 1.1 *

Case 4 Charmwood (Faridabad), VHP4A-142, 14963.0000V, STM1-128QAM, obj = -98.6
4-1 Okhla (Charmwood), VHP2-142, 14963.0000H, STM1-128QAM, v-i = 3.5, tad = 67.0 (i 0.0° v 191.9°), ifl = -99.3 (0.8), td = 2.6
4-2 Faridabad (Faridabad19), VHP2-142, 14963.0000V, STM1-128QAM, v-i = 3.3, tad = 62.0 (i 164.7° v 0.0°), ifl = -94.1 (-4.4), td = 5.7

Case 5 Faridabad19 (Faridabad), VHP2-142, 14963.0000V, STM1-128QAM, obj = -98.6
5-1 Okhla (Charmwood), VHP2-142, 14963.0000H, STM1-128QAM, v-i = 11.0, tad = 52.2 (i -2.3° v -5.7°), ifl = -100.5 (2.0), td = 2.1 *
5-2 Faridabad (Charmwood), VHP2-142, 14963.0000V, STM1-128QAM, v-i = 4.2, tad = 62.0 (i -164.7° v 0.0°), ifl = -102.2 (3.7), td = 1.6
5-3 Touch Tel (Faridabad19), VHP4A-142, 14963.0000H, STM1-128QAM, v-i = 4.4, tad = 68.0 (i 0.0° v -170.3°), ifl = -102.5 (3.9), td = 1.5
5-4 Mayur Vihar Ph-3 (Noida Sec10), VHP2-142, 14963.0000H, STM1-128QAM, v-i = 20.6, tad = 50.3 (i 1.3° v -341.0°), ifl = -104.2 (5.6), td = 1.0 *

Case 6 Faridabad (Faridabad19), VHP2-142, 14543.0000V, STM1-128QAM, obj = -98.6
6-1 Charmwood (Faridabad), VHP4A-142, 14543.0000V, STM1-128QAM, v-i = 3.3, tad = 62.0 (i 0.0° v 164.7°), ifl = -93.9 (-4.7), td = 5.9
6-2 Faridabad19 (Touch Tel), VHP2-142, 14543.0000H, STM1-128QAM, v-i = 4.2, tad = 68.0 (i 170.3° v 0.0°), ifl = -108.0 (9.4), td = 0.5

Case 7 Touch Tel (Faridabad19), VHP4A-142, 14543.0000H, STM1-128QAM, obj = -98.6
7-1 Faridabad19 (Faridabad), VHP2-142, 14543.0000V, STM1-128QAM, v-i = 4.4, tad = 68.0 (i -170.3° v 0.0°), ifl = -102.2 (3.7), td = 1.5
7-2 Vaishali (Mayur Vihar Ph-3), VHP4A-142, 14543.0000V, STM1-128QAM, v-i = 28.5, tad = 50.7 (i 0.7° v -352.4°), ifl = -95.1 (-3.5), td = 5.1 *

Case 8 Faridabad19 (Touch Tel), VHP2-142, 14963.0000H, STM1-128QAM, obj = -98.6
8-1 Faridabad (Faridabad19), VHP2-142, 14963.0000V, STM1-128QAM, v-i = 4.2, tad = 68.0 (i 0.0° v 170.3°), ifl = -108.2 (9.7), td = 0.4

Pathloss 4.0 : Link Budget Calculations

After we already decided antenna heights for each link we should calculate link budget for each link to find antenna diameter, link RX & Availability as the following steps

2.5.1- Go to Worksheets from Modules menu or by pressing ctrl W. you get work sheet page as shown in Fig. 2.5.1

Fig. 2.5.1

2.5.2- Enter Point frequency & polarization at each site by pressing on Ch. Then click OK As shown in Fig. 2.5.1 & 2.5.2


Fig. 2.5.2


2.5.3- Select Radio Equipment type by clicking on TR you will get Radio Equipment page as shown in Fig. 2.5.3

Fig. 2.5.3

2.5.4- click on Code Index then New Index. Go to your pathloss folder – Equipment – MRS – NEC (where you placed NEC equipment folder) as shown in Fig. 2.5.4

Fig. 2.5.4

2.5.5- Select your radio according to Type (3000S , Pasolink , Pasolink+ , …..) , Frequency ban (7G , 8G , 11G, …….) Modulation (16 QAM , 32 QAM , 128 QAM,….) Capacity (PDH x E1 , STM-0 , STM-1) then click Both to set same Radio for both stations then Press OK as shown in Fig. 2.5.5

Fig. 2.5.5

2.5.6- Set Branching Circuit or Hybrid Loss by clicking on its Symbol (above TR) then press OK as shown in Fig. 2.5.6


Fig. 2.5.6

2.5.7- Enter Feeder Data & connection losses by pressing on Wave Guide symbol then kick OK as shown in Fig. 2.5.7

Fig. 2.5.7

2.5.8- Select antenna type for each station by clicking on antenna symbol then press as shown in Fig. 2.5.8

Fig. 2.5.8


2.5.9- Press on Code Index then New Index then brows for pathloss folder (where you placed it) – Equipment – MAS – Antenna manufacturer (Andrew, RFS, …..) – Frequency Range (102-132 , 122 – 132 , 142 – 153 , …….)then press OK as shown in Fig. 2.5.9

Fig. 2.5.9


2.5.10- Select antenna for site 1 & press on Site 1 & select antenna for site 2 & press Site 2 or in case of both sites have same antenna press on Both. The press Close – OK as shown in Fig. 2.5.10

Fig. 2.5.10

2.5.11- Set Reliability Method
In worksheet page go to Operation Menu – reliability Methods as per attached in Fig. 2.5.11

Fig. 2.5.11

Set Reliability criteria as per shown in Fig. 2.5.11-1 for SDH or as Project & Customer requirement & press OK

Fig. 2.5.11.1
2.5.12- Set of Rain factor


Press on Rain symbol – select ITU-R-P-530. 6/8 – press Load Rain File – Select Rain area according to ITU-530 Map Fig. 1.2.3 (Rain Files are placed in Pathloss folder – Rain) – Press Close as per shown in Fig. 2.5.12

Fig. 2.5.12

2.5.13- Set Geoclimatic Factor
Press on the Ground Symbol (as shown in Fig. 2.5.13-1) – Set Geoclimatic Factor according to ITU-R-P-453 as Shown in Fig. 2.5.13-2)

Fig. 2.5.13-1

Fig. 2.5.13-2

2.5.14- Make sure of either our Path Calculation is correct or we need to revise again. To do that please check the followings
- Make sure that your worksheet page has Green Correct sign in Right Bottom of screen. If it is wrong sign that's mean there are some data mistake
- Have a look to RX Signal, Fade Margin & (Annual Availability with rain) Percentage as per shown in Fig. 2.5.14

Fig. 2.5.14

    • If any of (RX, Margin, Availability) is less than the required to meet the Spec. & recommendations. You have to increase antenna diameter or add Space Diversity Radio to reach to the required Spec.
    • So you go to step 2.5.10 again & select new antennas

2.5.15- After finish of path calculations go to Report Menu in Worksheet page – click Full Report
You will get full path calculation report as below one. You can copy it to Word or Excel sheet & save it for reference & submitting with your survey report

Pathloss 4.0 : Terrain Data & Obstruction Entry and Finding Suitable Antenna Heights

This Terrain Data should be got from accurate Contour Map or from Actual Path Survey. Actual Obstruction Location, Height & Type should be get from Path Survey

How to enter Terrain Data & Obstruction?

2.3.1- Go to Terrain Data Page from Module Menu. Or by Pressing ctrl T

2.3.2- Enter you Terrain data according to Map Scale as shown in Fig. 2.3.2

Map Scale
Fig. 2.3.2

2.3.3- Enter Obstructers by clicking on Structure position. Then choose structure type (Tree, Building or Water Tower). Enter this structure height in meters as per shown in Fig. 2.3.3

2.3.4- Repeat the above for the other obstacles

Fig. 2.3.3

After we entered Terrain Data & Obstacles Heights we have to find the suitable Antenna heights in each sites to grantee clear Line Of Sight (LOS) as the following steps

2.4.1- Go to Antenna Height page from Modules menu or by pressing ctrl A as shown in Fig. 2.4.1


Fig. 2.4.1

2.4.2- In Antenna Height page click on Optimize to get optimize antenna height for reference only as shown in Fig. 2.4.2

Fig. 2.4.2

2.4.3- The above Antenna is only for reference while the final antenna height will be decided according to the actual tower conditions & space availability

2.4.4- Go to Summary page & enter antenna heights which you think it will have clear LOS according to your path survey (mirror test or any other physical check) as shown in fig. 2.4.3

2.4.5- Go to Print Profile page from Module menu or by pressing ctrl P to confirm that link Fresnel zone has clear LOS above obstacles as shown in Fig. 2.4.5

2.4.6- If antennas heights which you entered still low to get clear LOS. Increase antenna height again according to available tower height till you get clear LOS with enough margin above obstacles

Fig. 2.4.3

Fig. 2.4.5

Pathloss 4.0 : Link by Link Pathloss Files Creations

After we finished of all sites data entry & making the link connections correct according to actual links configuration we have to go through link by link & create its pathloss file as the followings

2.2.1- Press on the link & click Summary as per shown in Fig. 2.2.1

2.2.2- In Summary Page Inter the design frequency band as shown in Fig. 2.2.2

2.2.3- Save this file in the same folder you saved the network

2.2.4- Repeat the above for the other links


Fig. 2.2.1

Fig. 2.2.2

Pathloss 4.0 : Site Data Entry and Creation of networks

To enter sites data to PATHLOSS program please follow the following steps

2.1.1- Run PATHLOSS & go to Module & Click Network or just Press Ctrl N to go to Network screen as per shown in Fig. 2.1.1

Fig. 2.1.1

2.1.2- In Network screen Click on Site Data & choose Site List as shown in Fig. 2.1.2

Fig. 2.1.2

2.1.3- In Site List Page Click on Edit then Add as shown in Fig. 2.1.3

Fig. 2.1.3

2.1.4- Inter Site Name, Call Sign (Station ID. This is important for Frequency Interference calculations. So if there is not Station ID you can give numbers for each station as Example 1 , 2, 3,….) , Latitude & Longitude then click OK as shown in Fig. 2.1.4

Fig. 2.1.4

2.1.5- Repeat steps 2.1.3 & 2.1.4 to enter other sites data then close Site List Page. Then you get Map grid with locations, Names of the entered sites data as shown in Fig. 2.15


Fig. 2.1.5

2.1.6- Connect between stations according to actual links configuration by press & drag from site to opposite site as shown in Fig. 2.1.6
Then repeat the above to connect all the links


Fig. 2.1.6

2.1.7- Save this network in pre prepared folder

Wednesday, March 24, 2010

Tems Investigation : Drive Test

In general, Drive Test can be define as a methode that used to verify the actual condition of RF signal certain operator at certain place.

Several functions of drive test :

- Analyzing customer complaint of certain operator in their home or office area

- Finding problem in BTS ( Timeslot Check, TRX Check, Swap Feeder)

- Analyzing the result of optimization process (continuity and all of area)

There are softwares can be used for drivetest that installed on laptop. TEMS Investigation (Ericsson), NEMO (Nokia).

Here the steps to start learning drivetest with TEMS Investigation :

a. Drive Test Equipment

1. TEMS Handset (complete with Charger, Headset, Data Cable) and USB Hub

1

2

2. Laptop (installed TEMS Investigation) and Adapter

3

4

3. GPS (Ext Antenna and Data Cable)

5

4. ATEN (Serial to USB)

6

5. Scanner for WCDMA (Ext Antenna GPS and RF, Data Cable)

7

6. Inverter and Terminal

8

9

7. Battery and Charger

10


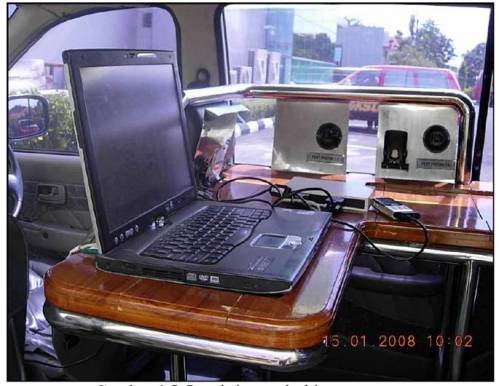
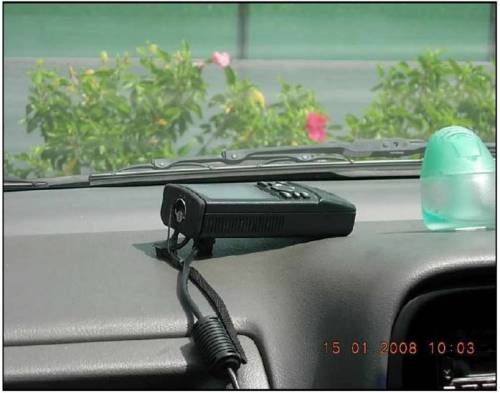
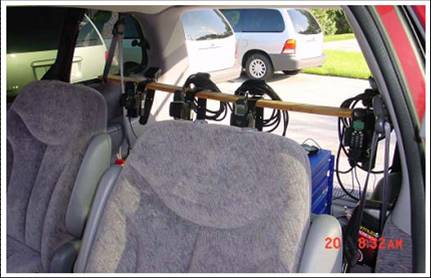
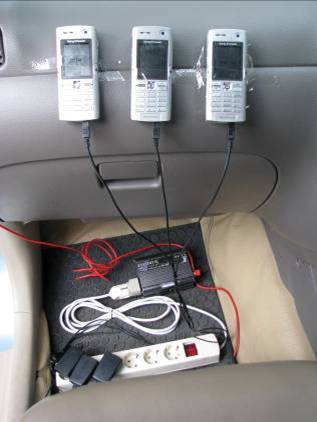
Example postion of that equipments in car :

1a


2a


3a


4a

B. Laptop Configuration

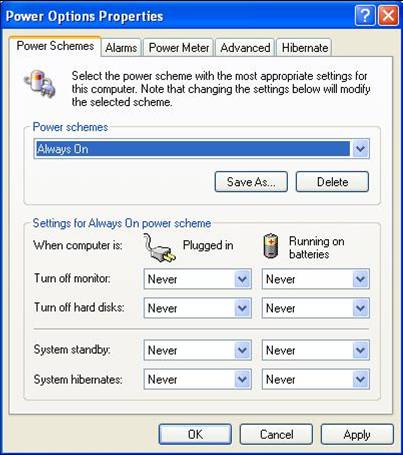
1. Power Management

Set Power Management Laptop always On :

Start -> Settings -> Control Panel -> Power Options -> Set All Power Scheme “never”

laptop-pwrmng

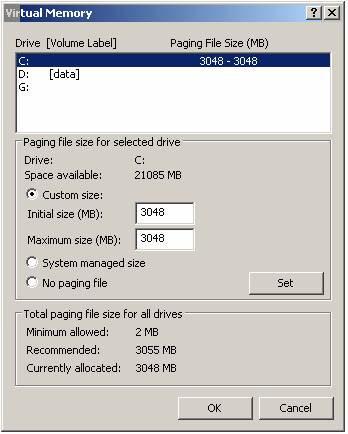
2. Virtual Memory

Set Virtual Memory :

Start -> Settings -> Control Panel -> System

Advance -> Performance Settings

laptop-virmem

C. TEMS Investigation :

- Workspace Configuration

After installition process, open Tems Investigation.
>> All Programs -> TEMS Investigation -> Data Collect

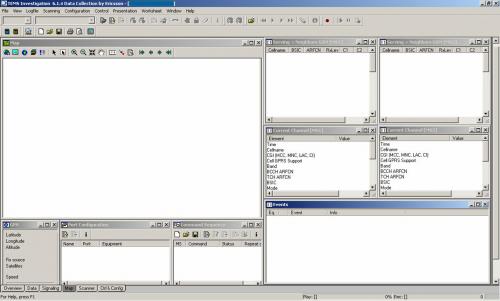
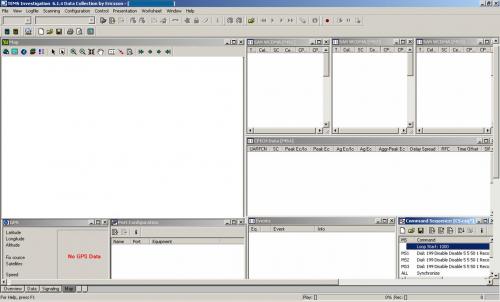
This is the example workspace for 2G (Mode Dedicated-Idle).

2g-wrkspc

1. Open Worksheet Map & arrange size of window Map

2. GPS (Presentation -> Positioning -> GPS)

3. Port Configuration (Configuration -> Port Configuration)

4. Command Sequence (Control -> Command Sequence)

5. Serving + Neighbours GSM (Presentation -> GSM -> Serving + Neighbours GSM)

6. Current Channel (Presentation -> GSM -> Current Channel)

7. Event (Presentation -> Signalling -> Events)

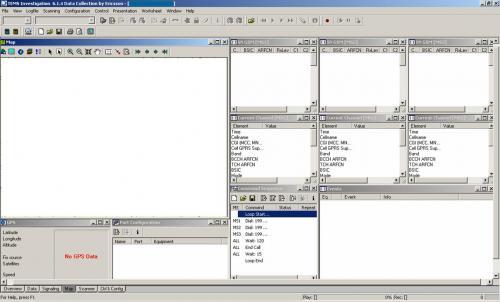
for benchmark workspace, add Serving + Neighbours GSM and Current Channel for MS3.

2g-bchmrk1


3g-bchmrk


- Map Configurations

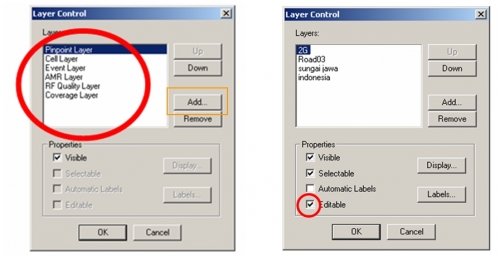
Create Geoset : Click Geoset Manager on Map window map-geoicon

1. On layer control map-layericon remove all layer except Pinpoint, Cell, Event, AMR, RF Quality and Coverage layer

2. Add layer Route, Road, MCOM Site, and other *.tab

map-crtgeoset

3. Save Geoset

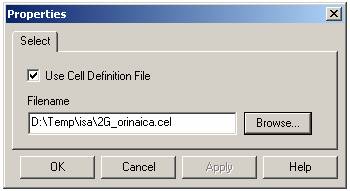
4. Load Cell file : Configuration -> General -> Cellfile Load

5. Use Cell Definition File then choose cell file

map-cell

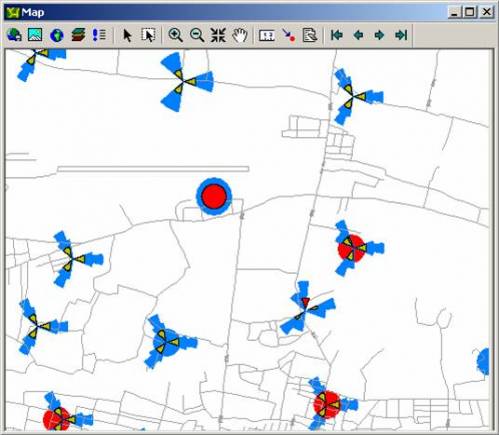
6. ie. Map window configured

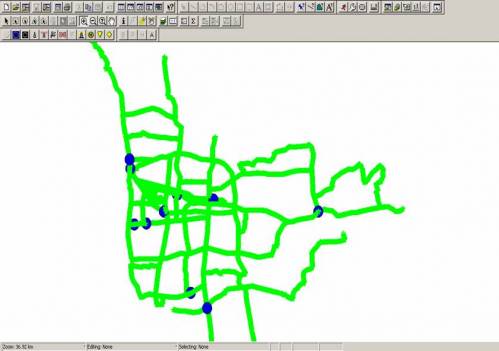
map-ie

- Port Equipment Configurations

(see my older post :-))

- Command Sequence Configurations

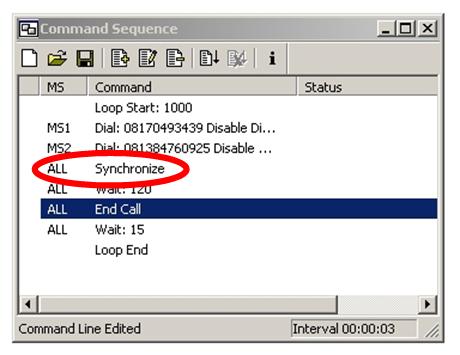
Voice Call CS

i.e “120/15” means 120 second on call then call end, 15 second wait and then call again.

1. Loop Start give the number of repetition for command below the loop start (General -> Loop Start)

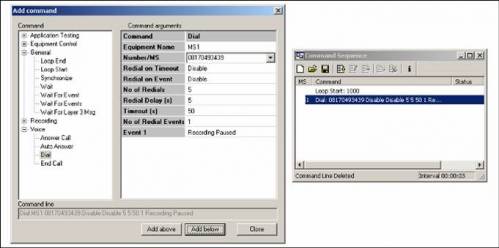
2. Dial select the MS and give the destination number (Voice -> Dial)

cs-ms1


3. Synchronize to synchcronize MS before go to the next command (General -> Synchronize)
cs-sync

4. Wait 120 wait 120s on call (General -> Wait)

5. End Call (Voice -> End Call)

6. Wait 15 wait 15 before call again (General -> Wait)

7. Loop End (General -> Loop End)

Video Call CS

In general cs for video call is same as voice call, but in video call in dial command we must add “v”.

i.e

Loop Start

Dial v081384760975

Wait 120

End Call

Wait 15

Loop End

D. DRIVE TEST

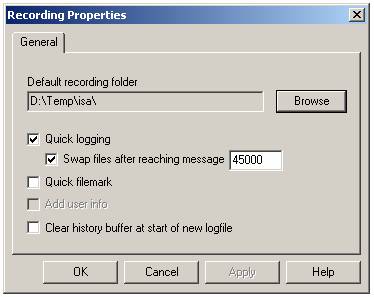
1. Configure Recording Properties : Menu Tab Logfile -> Recording Properties

2. Select recording folder : Click Browse -> Select Directory

3. Select Quick logging and setup size of swap file “after reaching message “

godt-recprop

4. Use 2G or 3G configured workspace (with spacific map : road, route, cell file)

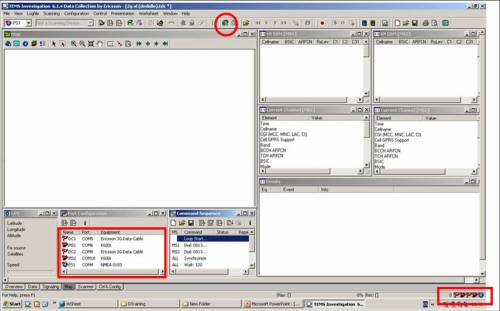
5. Make sure all equipments configured to the right port

6. Connect all godt-connecticon

godt--connectall

7. After all equipments connected (symbol green), window gps, serving neighbour gsm, current channel and events will be full filled

8. Don’t forget to lock TEMS Handset into GSM only or 3G only.

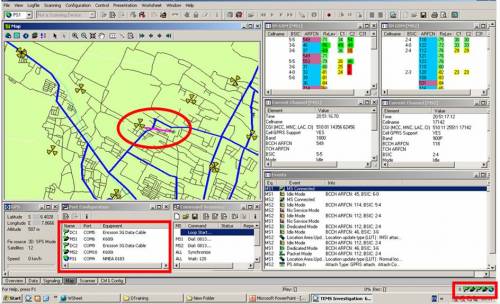
godt-workspace

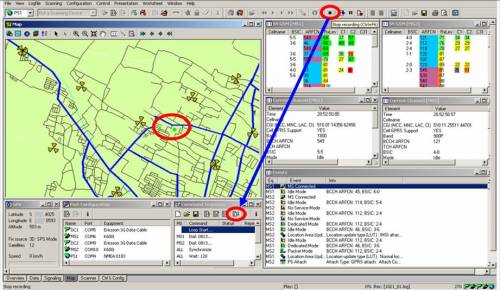
9. To start drive test, click record then start command sequence

godt-record

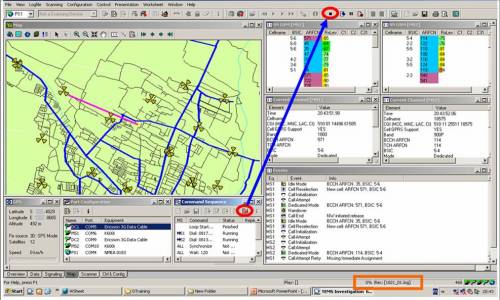
10. After all route complete, wait untill call end then stop command sequence and stop recording.

godt-stoprec

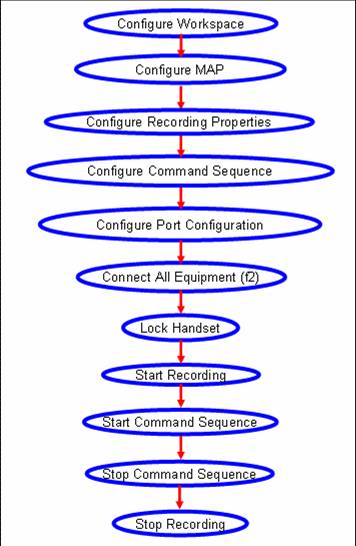
Here the flow step by step Go Drive Test !!!

godt-flow


E. LOG FILE CHECKING

Check logfile by playing one by one or export into MapInfo-Tab file

logcheck

F. POST PROCESSING:

- Report Generator

1. Open TEMS Data Collection : Start -> TEMS Products -> TEMS Investigations6.1.4 Data Collection

2. Menu Tab Logfile -> Report Generator

3. Add logfile

repgen-add

4. Setup Output directory

repgen-outdir

5. Setup Report properties

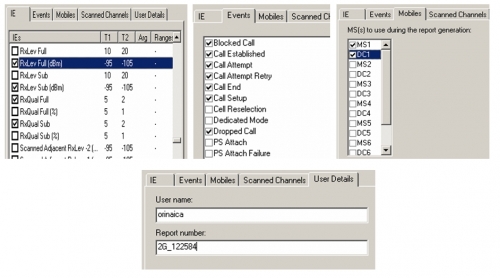
6. Setup IEs, Events, Mobiles, and User Details

repgen-setup

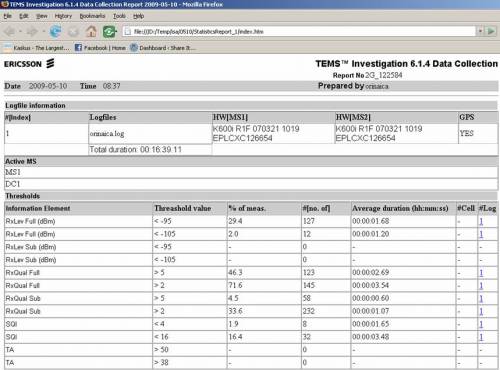
7. Result of Report Generator in *.htm

repgen-result

- Map Info (Plot IEs)

Before post process in mapinfo, created *.tab file from logfile in TEMS :

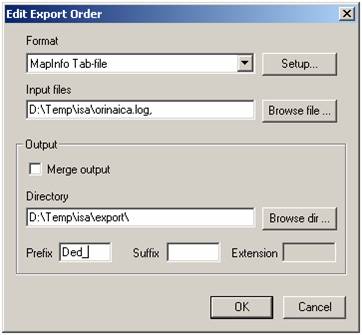
1. Export logfile : Menu Bar Logfile -> Export Logfile

2. Click Add Order mapinfo-addicon

3. Choose Format : MapInfo Tab-file

4. Setup IEs (Info Elements)

for GSM Dedicated or Idle :

- RxLev Full (dBm)

- RxLev Sub (dBm)

- RxQual Full

- RxQual Sub

- SQI

- TA

- Cell Id

- Frequncy Band

- Latitude

- Longitude

for WCDMA Dedicated / Idle / Scanner :

- AS Cell Name

- AS CPICH Ec/No

- AS CPICH RSCP

- SAN CPICH Ec/No

- SAN CPICH RSCP

- SAN Cell Id (CI Part)

- Sc 1st Aggr Ec (dBm) -> Scanner

- Sc 1st Aggr EcIo (dB) -> Scanner

- Sc Best SC -> Scanner

- Latitude

- Longitude

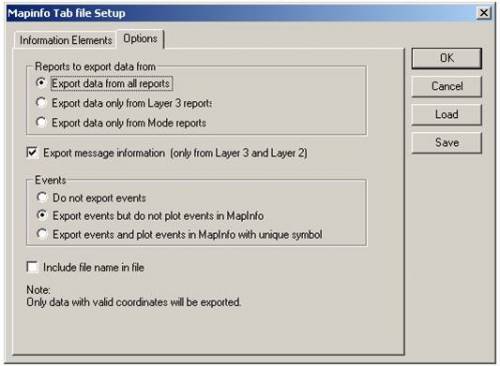
5. Configure Options Tab

mapinfo-option

6. Save *.mex

7. Choose Logfile : Click Browse file

8. If there are more than one logfile we can merge it by Merge Output

9. Choose Output directory : Click Browse dir

10. Give Prefix : Ded if Dedicated and Idle if Idle

mapinfo-prefix

11. Start process, click start mapinfo-starticon

mapinfo-export

12. If done, status Success

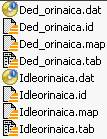
13. There were created four files for each action (*.dat, *.id, *.map, *.tab)

mapinfo-createdfiles

14. Open the exported file into MapInfo : Menu Tab File -> Open

mapinfo-openexport

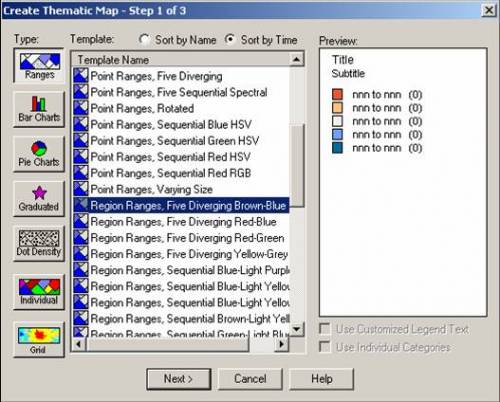
15. Create Thematic Map : Menu Tab Map -> Create Thematic Map

16. Choose Type -> Range

17. Template Name -> Region Ranges

mapinfo-thematic

18. Choose Table and Field (ie. Plotting RXQUAL_SUB from Dedicated mode)

mapinfo-seltable

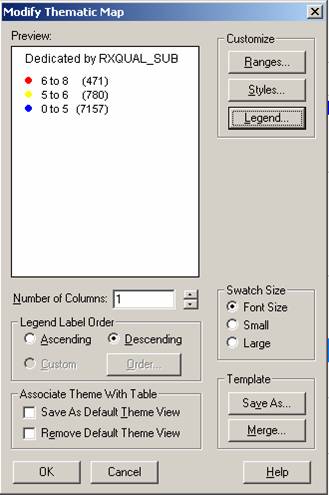
19. Customize Ranges, Style and Legend.

mapinfo-index

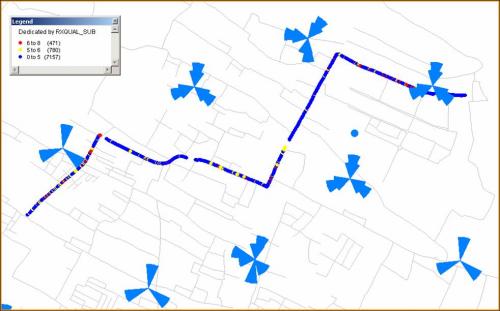
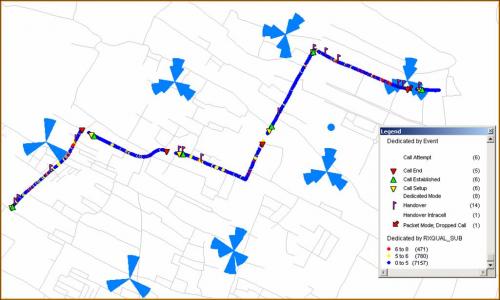
20. Example Dedicated by RXQUAL_SUB

mapinfo-result

EVENTS on RXQUAL_SUB

21. Create Events on RXQUAL_SUB

22. Open again the exported file (Ded_orinaica)

23. Create Thematic Map : Menu Tab Map -> Create Thematic Map

24. Choose Type -> Individual

25. Template Name -> Region IndValue Default

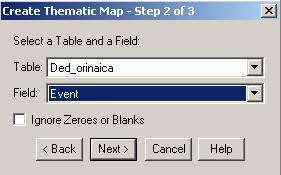
26. Choose Table and Field

mapinfo-event

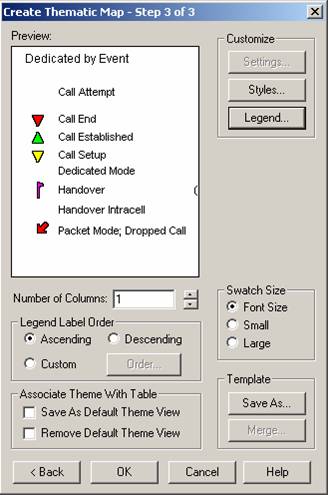
27. Customize Style and Legend

mapinfo-eventindex

28. Example Events on RXQUAL_SUB

mapinfo-resultevent

SPIDER GRAPH

29. Activate spider graph : Menu Tab Tools -> Tool Manager

30. Spider Graph Load and Autoload

31. See table structure of cell in MCOM Site : Menu Tab Table -> Maintenance -> Table Structure -> View/Modify Table choose MCOM Site

mapinfo-spdgrph01

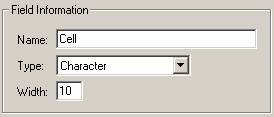
32. See table structure of CI in exported file : Manu Tab Table -> Maintenance -> Table Structure -> View/Modify Table choose exported file (ie. Ded_orinaica) -> Change type structure of CI

mapinfo-spdgrph02

33. Click OK

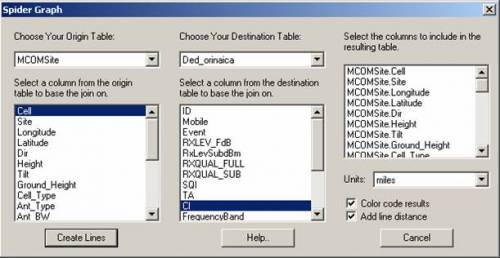
34. Create Spider Graph : Tools -> Spider Graph -> Spider Graph

35. Choose Origin and Destination table

mapinfo-oridest

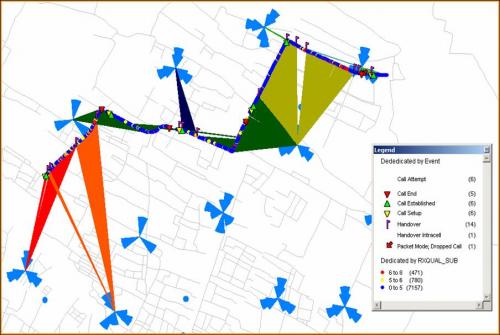
36. Save the Spider Graph table : Save Copy As -> (ie. orinaica)

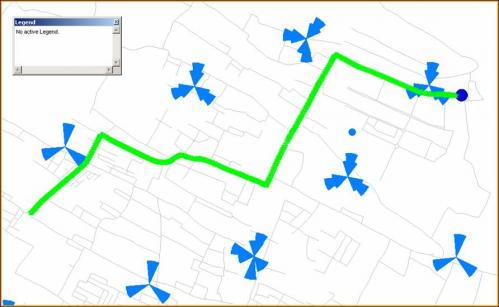
37. From Spider Graph, We can analyze :

- Dominant Cells

- Overshoot Cells

- Swap Feeder

mapinfo-resultspider

G. TROUBLESHOOTING :

- 2G Frequency Scanning

Purpose : to verify level signal each BCCH ARFCN plan

1. Setup frequency scan : Click Scan Properties 2Gscan-scanicon

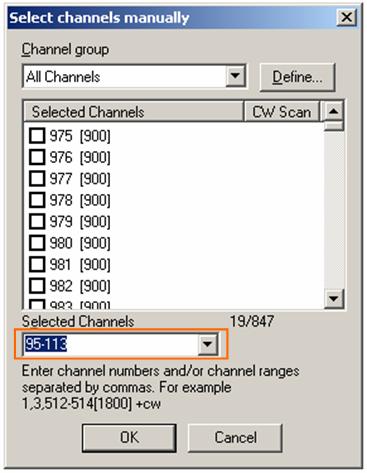
2. Select channels : Tab Scanned channels -> Manual selection -> Select

3. Setup Selected Channels (ie. BCCH ARFCN are 95-113)

2Gscan-selchan

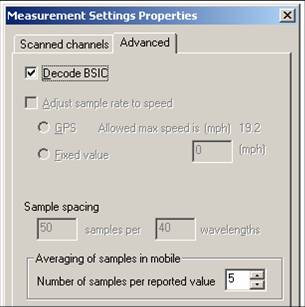
4. Decode BSIC

2Gscan-decbsic

5. Start Scanning : Click toolbar Start Scanning 2Gscan-start

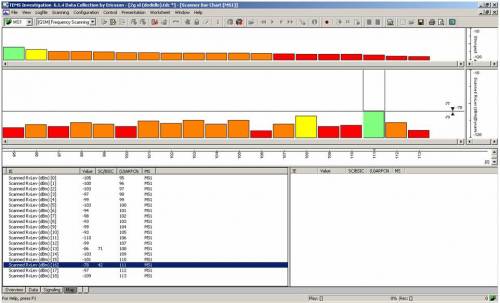
6. See Scanner Bar Chart Window : Menu Bar Presentation -> GSM -> Frequency Scanner -> Scanner Bar Chart

2Gscan-scbarchrt

- Time slot check

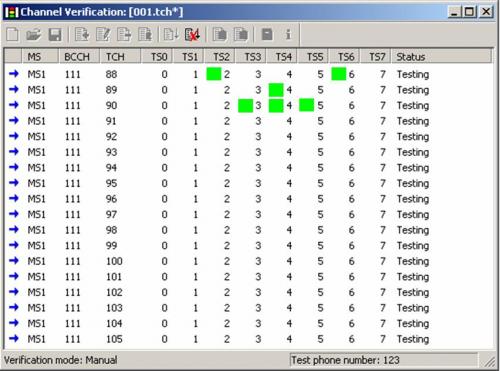
Purpose : Check Time Slot in each TCH (if Freq Hop : NO or Base Band)

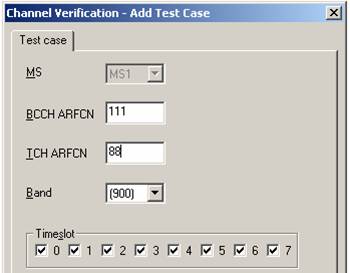
1. Setup Channel Verification : Menu Bar Control -> GSM Channel Verification

ts-setch

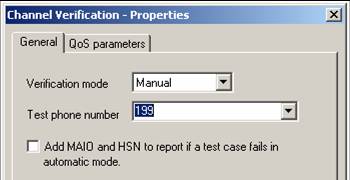
2. Setup test phone number : Click Properties on Channel Verification window ts-propicon

ts-dial

3. Green mark means time slot have been used

ts-tested

- TRX Check

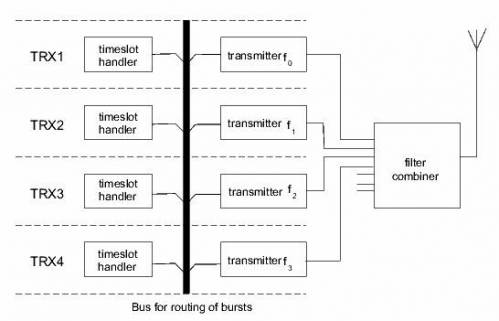
Purpose : to verify damage TRX in each sector

Where is TRX ?

trx-whatis

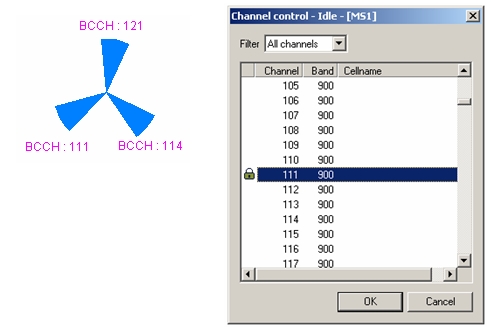
1. Lock BCCH ARFCN certain sector : Click Toolbar Lock on Channel trx-lockicon (ie. Check TRX Sector 1, Lock BCCH 111)

trx-lock

2. Disable Handover : Click Toolbar Disable Handover trx-dishoicon

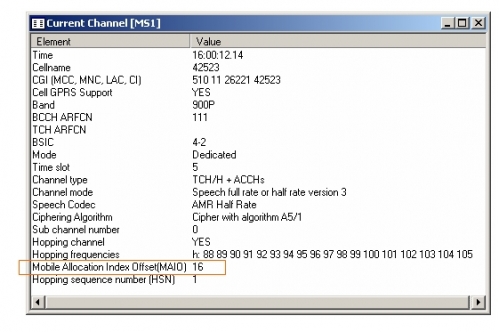
3. See MAIO on Current Channel window

trx-curch

- Swap Feeder Check

Purpose : to verify intalation mistake on feeder cable to BTS

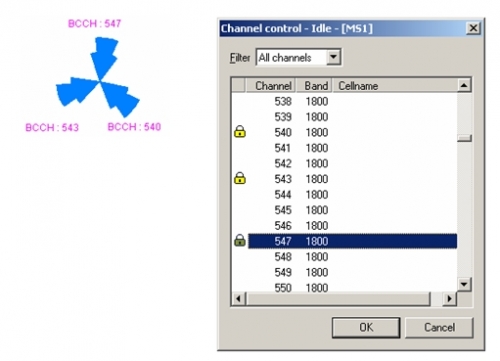
1. Lock BCCH ARFCN each sector : Click Toolbar Lock on Channel swap-lockicon (ie. BCCH Sect 1 = 547, Sect 2 = 540, Sect 3 = 543 )

swap-lock

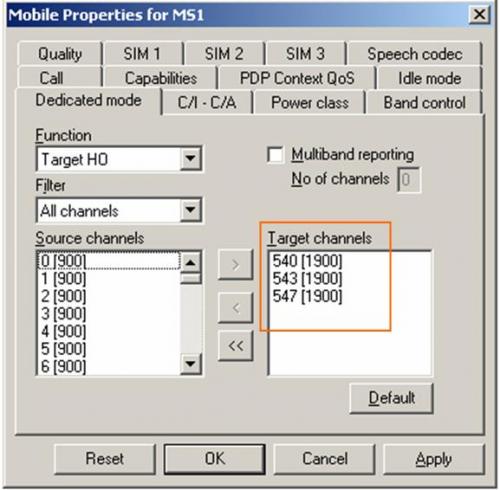
2. Set HO Target : Equipment Properties -> Dedicated Mode -> Function -> Target HO (ie. BCCH 547, 540, 543)

swap-mobprop

3. Create drive route that can represent each sector

4. Export logfile into *.tab with IEs CI

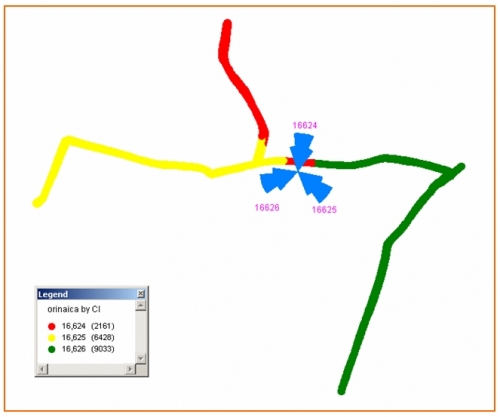
5. Create thematic map for each CI (Cell Identity)

swap-result

Picture above indicate swap feeder between sector 2 and 3.